
Introduction: Is Now a Good Time to Buy in Markham?
Is now a good time to buy in Markham? Yes, if three things are true. You can carry the payment if rates run half a point higher. You plan to stay five years or more. You’ll still have savings after closing.
If those hold, September’s numbers lean your way. Markham’s benchmark price is down about 6% from a year ago, and homes sold for about 98% of asking. If any one of the three is shaky, waiting is a fair call. Nobody can promise you the bottom, and I won’t try.
I’m working from TRREB’s September report, released October 6, plus the Bank of Canada’s latest decision and current mortgage rates. Here’s what the numbers say.
What did the Markham housing market do in September 2026?
The Toronto Regional Real Estate Board (TRREB) released its September numbers on October 6. Here’s Markham, all home types:
| Markham, all home types | September 2026 |
|---|---|
| Sales | 245 |
| Average sale price | $1,125,353 |
| Median sale price | $1,051,000 |
| New listings | 729 |
| Active listings at month end | 1,122 |
| Months of inventory | 4.1 |
| Sales-to-new-listings ratio | 40.5% |
| Average sale price vs. list price | 98% |
| Average days on market (sold listings) | 34 |
Months of inventory and the sales-to-new-listings ratio are TRREB’s 12-month moving averages.
Two numbers tell most of the story. Sellers listed 729 homes in September. Buyers bought 245. Not every listing sells in the month it hits the market, so don’t read that as three homes for every buyer. Read it as a market with room to choose.
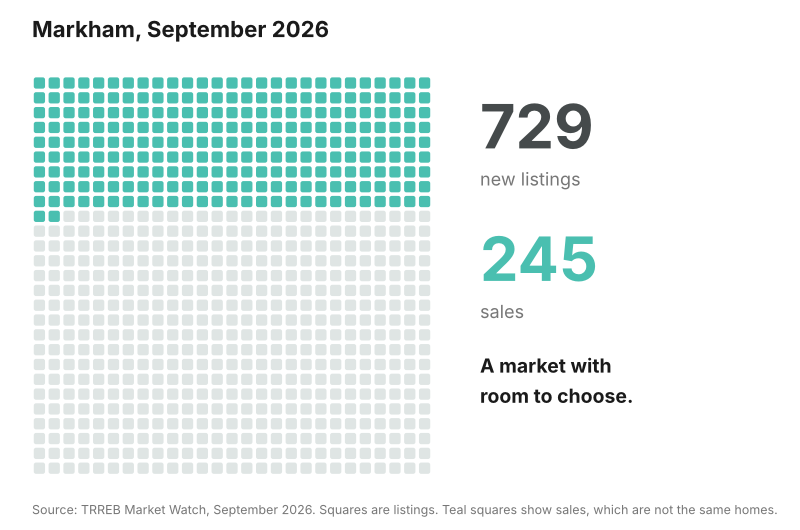
Source: TRREB Market Watch, September 2026. Listings and sales in the same month are not the same homes.
By the usual rules of thumb, Markham sits in balanced territory. A sales-to-new-listings ratio between 40% and 60% counts as balanced, and Markham’s 40.5% is right at the bottom of that range, the buyer-friendly end.
At 4.1 months, inventory is balanced too, though it sits at the seller’s end of its range. The two measures point in slightly different directions. That’s what balanced looks like.
Are Markham home prices actually falling?
Yes. Compare like with like, though. Average prices jump around with whatever sold that month, so I use TRREB’s benchmark price, which tracks a typical home over time.
Markham’s benchmark price for all home types was $1,052,500 in September, down 6.02% from a year ago. The GTA overall was down 4.65%. York Region as a whole was down 6.50%. Markham is sliding a bit faster than the GTA and a bit slower than York Region.
| Markham benchmark price | September 2026 | Change vs. September 2025 |
|---|---|---|
| Detached | $1,441,700 | Down 5.61% |
| Single-family attached | $1,032,900 | Down 5.52% |
| Townhouse | $731,700 | Down 6.62% |
| Apartment | $517,200 | Down 9.70% |
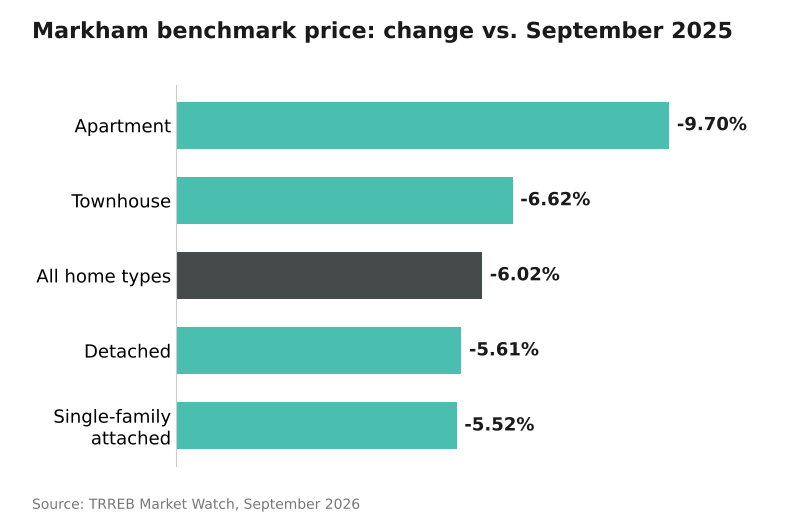
Source: TRREB Market Watch, September 2026. Benchmark price change vs. September 2025.
Apartments took the biggest hit at 9.70%. Detached homes fell 5.61%.
Here’s what actually sold in September, by type:
| Markham home type | Sales | Median sale price | Avg. sale price vs. list price | Avg. days on market |
|---|---|---|---|---|
| Detached | 108 | $1,381,500 | 98% | 31 |
| Semi-detached | 18 | $999,000 | 101% | 30 |
| Attached / row townhouse | 30 | $918,490 | 100% | 32 |
| Condo townhouse | 23 | $735,000 | 98% | 35 |
| Condo apartment | 55 | $535,000 | 98% | 40 |
Not every segment is soft. Semis and attached townhouses sold at 101% and 100% of asking. Those are small samples, 18 and 30 sales, so treat them as hints, not proof. Condo apartments are the slowest corner: 40 days on market on average, and 354 active listings against 55 sales.
Will Markham home prices keep falling?
Maybe. Nobody knows. TRREB’s report shows sales, new listings and prices all edged lower from August on a seasonally adjusted basis, GTA-wide. GTA sales were down 9% from last September. New listings fell 14.4%.
Fewer sellers are coming forward, which can tighten things up if buyers return. TRREB’s chief information officer said in the May report that prices should level off, and could start growing as 2027 begins, if sales strengthen relative to listings. That’s a forecast, not a promise.
Here’s a way to size the bet. A 3% move on Markham’s $1,052,500 benchmark price is about $31,600. If prices slide another 3% after you buy, you paid $31,600 more than you had to. If they climb 3% while you wait, waiting costs you the same. Same coin, either side. Guessing is a coin flip. A plan built on your own numbers is not.
How much do mortgage rates change what a Markham home costs?
The Bank of Canada held its rate at 2.25% on September 2 and said upside risks to inflation have increased. The next decision is October 28. Fixed mortgage rates follow bond yields, so they can move before the Bank does anything. On September 25, the lowest insured five-year fixed rate at nesto was 4.39%, and Canada’s average conventional five-year fixed rate was 5.12%.
Here’s what that looks like in monthly payments. I used 5%, a round number just under the average conventional rate, with 20% down and a 25-year amortization. Purchase prices are Markham’s September medians.
| Home type | Median price | 20% down | Mortgage | Monthly payment |
|---|---|---|---|---|
| Detached | $1,381,500 | $276,300 | $1,105,200 | $6,428 |
| Attached / row townhouse | $918,490 | $183,698 | $734,792 | $4,274 |
| Condo apartment | $535,000 | $107,000 | $428,000 | $2,489 |
Now stress it. Half a point either way moves the detached payment by about $315 a month, roughly $3,800 a year.

The number that matters most is the one you run at your own kitchen table.
Those payments cover principal and interest only. Property tax, insurance, utilities and condo fees come on top, and so do land transfer tax, legal fees and commission when you sell. I broke the whole bill down in the real cost to move up in Markham. I’m not a mortgage advisor, so get a pre-approval and a rate quote from a mortgage professional before you shop.
Is it a good time to move up in Markham?
If you’re selling to buy, you’re in this market on both sides. The question is whether the gap between the home you own and the one you want is shrinking. In Markham, it is.
The benchmark detached home sits at $1,441,700, down 5.61%. That’s roughly $85,000 below last September. The benchmark single-family attached home sits at $1,032,900, down 5.52%, roughly $60,000 below last September. The bigger home fell by more in dollars.
Today the gap between the two is about $410,000. A year ago it was about $435,000. The gap shrank by about $25,000. You’ll sell into the same softer market, and the math still works because the home you’re buying fell by more.
The dollar figures are back-calculated from TRREB’s year-over-year changes, so treat them as close estimates.
Your home isn’t the benchmark. Layout, lot, condition and street all move your number. I walk through the full Move-Up Math in a separate guide. Want yours run properly? DM me the word TIMING or call 416-998-8853.
Who should buy in Markham now, and who should wait?
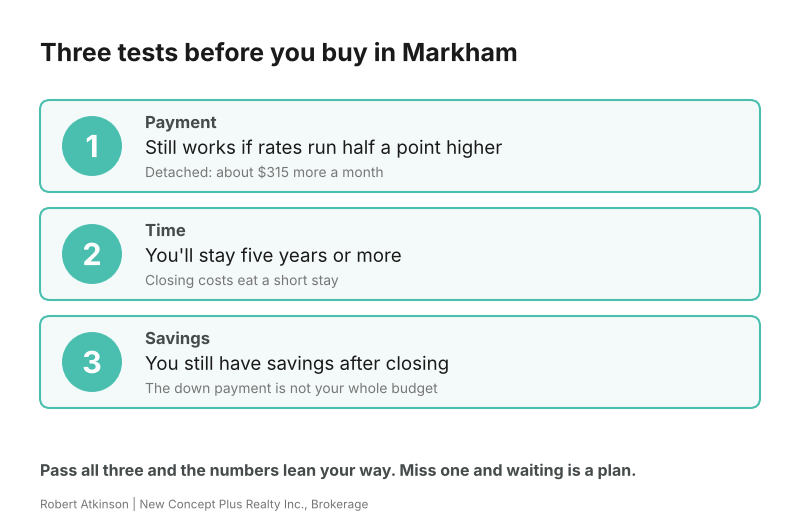
Pass all three and the numbers lean your way. Miss one and waiting is a plan.
Buy now if:
- You plan to stay five years or more.
- Your payment still works if rates run half a point higher.
- You’ll have savings left after the down payment and closing costs.
- Your income feels steady.
- You’ve found a home that fits, and the price lines up with recent sales of similar homes.
Wait if:
- You’d have to stretch to your maximum approval to make it work.
- The down payment and closing costs would drain your emergency fund.
- A move in under three years is likely. Closing costs eat a short stay.
- Your job situation is uncertain.
Landing on the wait side isn’t failure. It’s a plan, and it’s a better one than buying scared. Not sure how many homes to see before you decide? I wrote a guide to that.
Is Now a Good Time to Buy in Markham? Your Questions Answered
Is it a buyer’s market in Markham right now?
Not quite. TRREB’s sales-to-new-listings ratio for Markham is 40.5%, and inventory is 4.1 months. Both read as balanced by the usual rules of thumb. Prices are soft anyway, down 6.02% from last year.
How much have Markham home prices dropped?
TRREB’s benchmark price for all home types is down 6.02% from September 2025, to $1,052,500. Detached is down 5.61%. Apartments are down 9.70%.
What does a detached home cost in Markham?
The median sale price in September was $1,381,500. The benchmark price is $1,441,700. With 20% down, plan on $276,300 for the down payment, before closing costs.
Will mortgage rates drop soon?
Nobody knows. The Bank of Canada decides on October 28 and has said upside risks to inflation have increased. Fixed rates follow bond yields. Plan around the payment you can afford today.
What is the monthly payment on a typical Markham home?
At 5%, a 25-year amortization and 20% down, the September median prices work out to about $6,428 a month for a detached home, $4,274 for an attached or row townhouse and $2,489 for a condo apartment. That covers principal and interest only. Property tax, insurance and condo fees come on top.
Are condos in Markham cheaper than houses?
Yes. The September median sale price for a Markham condo apartment was $535,000, against $1,381,500 for a detached home. Condo apartments are also the softest segment: the benchmark price is down 9.70% from last year and sold listings took 40 days on average.
How long does it take to sell a home in Markham?
Sold listings in Markham averaged 34 days on market in September. Detached homes averaged 31 days and condo apartments 40. Those are averages for homes that sold, so a home that sits unsold is not counted.
Do Markham homes sell over asking price?
On average, no. Markham homes sold for about 98% of list price in September. Semi-detached and attached townhouses sold at 101% and 100%, but those samples are small, 18 and 30 sales.
Should I wait for the October 28 Bank of Canada decision before buying?
Waiting for one date rarely settles it. Fixed mortgage rates follow bond yields and can move before the Bank does. Test your budget instead. A half-point rate change moves a detached payment by about $315 a month, so if the payment still works at a half point higher, the decision day matters less.
The numbers help buyers who are ready. They don’t reward guessing.
If you want these figures for your street and your price range, I’ll run them with you. Your payment, your timeline, your move.
Ready to see if now is your time?
DM me TIMINGSources: TRREB Market Watch, September 2026. TRREB Market Watch, May 2026. nesto.ca five-year fixed rates, September 25, 2026. Bank of Canada September 2 rate hold, via CREA Stats. Market data is from the TRREB MLS® system and reflects activity through September 30, 2026. TRREB revises past monthly figures. Payment examples are estimates for illustration, not mortgage advice or a rate quote. MLS® is a registered trademark of the Canadian Real Estate Association. Robert Atkinson, Broker, New Concept Plus Realty Inc., Brokerage.
